Defining CO2 Capture and Utilisation
Carbon capture and utilisation (CCU) encompasses a range of applications where CO2 is captured and then used either directly (without chemical alteration) or indirectly (where it’s transformed) in various products. Currently, CO2 is primarily used in the fertiliser industry and for enhanced oil recovery. However, emerging applications such as CO2-based synthetic fuels, chemicals, and building aggregates are gaining momentum.
Role in Clean Energy Transitions
It’s essential to note that CO2 utilisation doesn’t always lead to reduced emissions. The climate benefits associated with a particular CO2 utilisation depend on the CO2’s origin, the product it replaces, the carbon intensity of the energy used in the conversion, and how long the CO2 remains in the product.
Future Directions for CO2 Utilisation
While some CO2 utilisation applications can offer significant climate benefits, their market size is relatively small. Therefore, the primary focus should be on dedicated storage in the broader context of carbon capture, utilisation, and storage (CCUS). However, support from research, development, and demonstration can accelerate the deployment of scalable CO2-derived products and services.
Tracking CO2 Capture and Utilisation
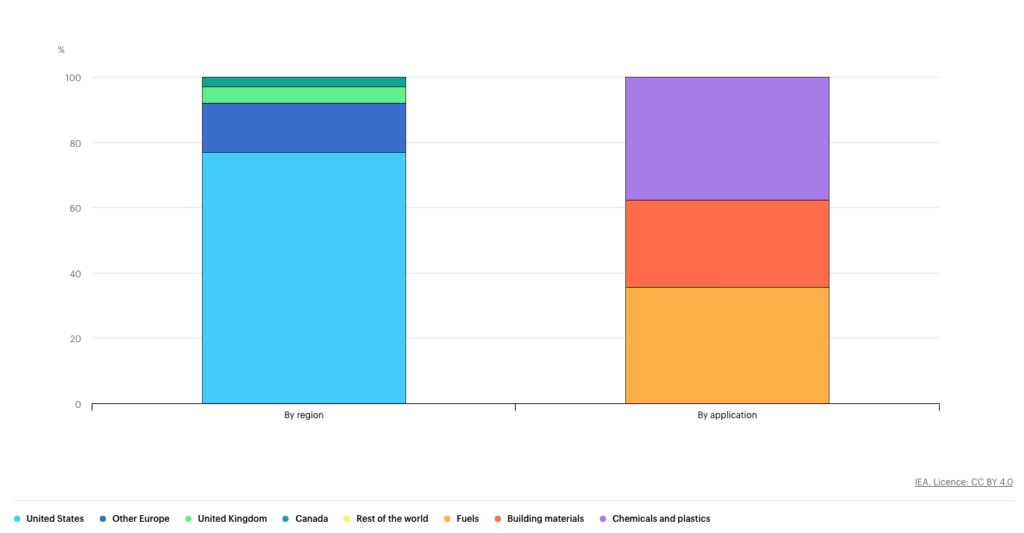
Carbon capture and utilisation (CCU) includes applications where CO2 is captured and then used either directly or indirectly in various products. Currently, around 230 million tonnes of CO2 are utilised annually, mainly in the fertiliser sector for urea production (~130 million tonnes) and for enhanced oil recovery (~80 million tonnes). Emerging utilisation pathways, especially CO2-based synthetic fuels, chemicals, and building aggregates, are gaining traction. If all announced projects are realised, they could capture about half the CO2 utilisation level for synthetic fuel production by 2030 projected in the Net Zero Emissions by 2050 scenario.
Country and Regional Highlights
- USA: The 2022 Inflation Reduction Act increased the 45Q tax credit for CCUS, supporting CO2 utilisation. Additionally, the Clean Fuels & Products Shot initiative was launched in May 2023.
- European Union: In April 2023, the ReFuelEU Aviation proposal was approved, imposing blending mandates on synthetic aviation fuels. Three CCU projects targeting synthetic fuel also received EU Innovation Fund support in 2022.
- Belgium: In December 2022, the first large-scale plant converting steel emissions to ethanol was commissioned.
- Canada: The 2022 federal budget proposed a tax credit for CCUS projects, especially for utilisation equipment.
CO2 Emissions and Climate Benefits
CO2 utilisation can offer climate benefits, but under specific conditions. The benefits depend on the CO2 source, the replaced product, the energy’s carbon intensity used for conversion, and the CO2’s retention duration in the product. In the Net Zero Emissions scenario, over 95% of captured CO2 in 2030 would be geologically stored, with less than 5% being utilised.
Activity in CO2 Utilisation
CO2 utilisation for synthetic fuels is emerging as the primary new utilisation route. Several large-scale plants are in operation, with around 15 more planned, targeting CO2 utilisation for synthetic hydrocarbon fuels. These plants could capture and utilise approximately 7 million tonnes of CO2 by 2030. The largest plant, in operation since 2020, captures up to 1 million tonnes of CO2 annually from a coal-to-liquids plant in China. The CO2 is then used to produce synthetic hydrocarbon fuels. Other large-scale plants are in operation or under construction in the United States, Europe, and Asia.
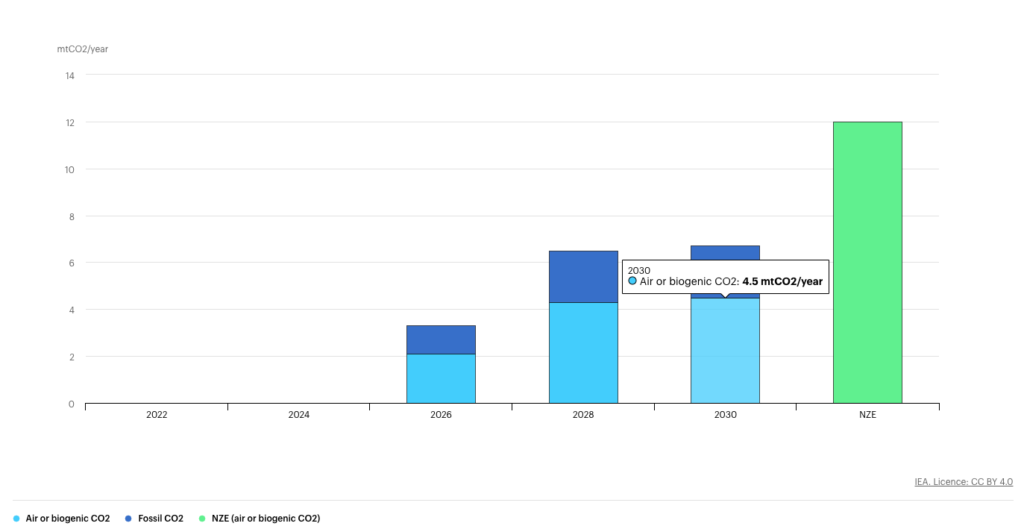
Notes: NZE = Net Zero Emissions by 2050 Scenario. Only includes carbon capture and utilisation projects with an identified capture facility for the source of the CO2, with a capacity larger than 100 000 t CO2 per year. When the fraction of biogenic emissions out of total captured CO2 is unknown, it is assumed that the share of biogenic emissions is 50% in waste-to-energy plants.
Technology Installation and Infrastructure
CCU supply chains can leverage synergies with fossil-based synthetic fuel production and CCS. The extensive use of hydrogen and CO2 for conversion necessitates large-scale transport infrastructure, including pipelines and terminals.
Innovation in CCU
Key innovation areas include reducing the energy required for CO2 conversion and demonstrating the reliability of CO2-based construction materials. Early demonstrations can refine and reduce technology costs for carbon capture, storage, and utilisation.
Policy Support for CCU
Policy incentives, such as mandates, public procurement, low-emission standards, and tax credits, are bolstering CCU project development. For instance, the European Union’s ReFuelEU Aviation proposal and the USA’s 45Q tax credit are significant policy drivers.
Investment in CCU
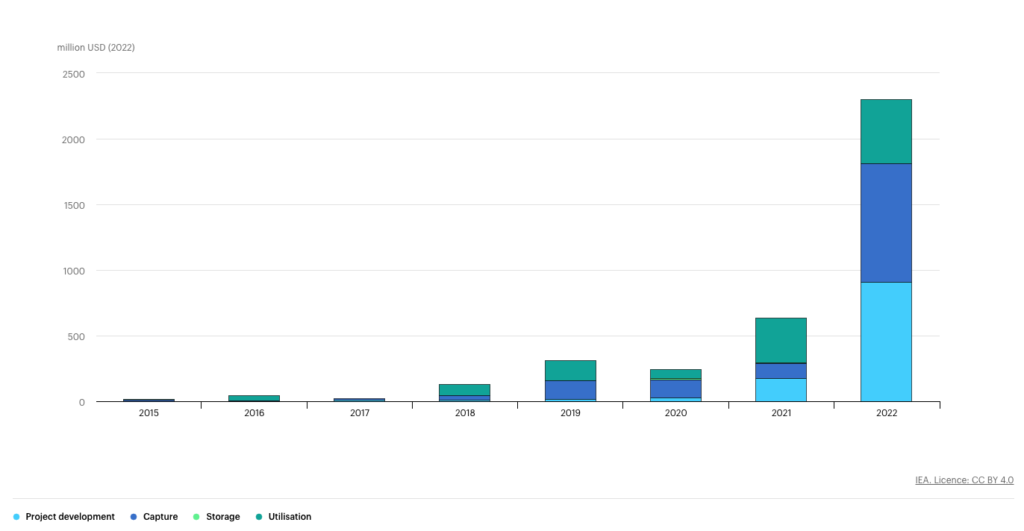
Venture capital investment in CCU has been increasing, reflecting growing interest in CO2 conversion technologies. In 2022, global venture capital investment in utilisation companies reached nearly USD 500 million, up from USD 350 million in 2021. The largest investments were in companies developing CO2-based synthetic fuels and chemicals. Several companies also raised significant capital through initial public offerings. In addition, corporate investment and partnerships are growing, particularly in the aviation and automotive sectors, which are seeking to secure future supplies of low-carbon fuels and materials.
Sources
https://www.iea.org/energy-system/carbon-capture-utilisation-and-storage/co2-capture-and-utilisation